

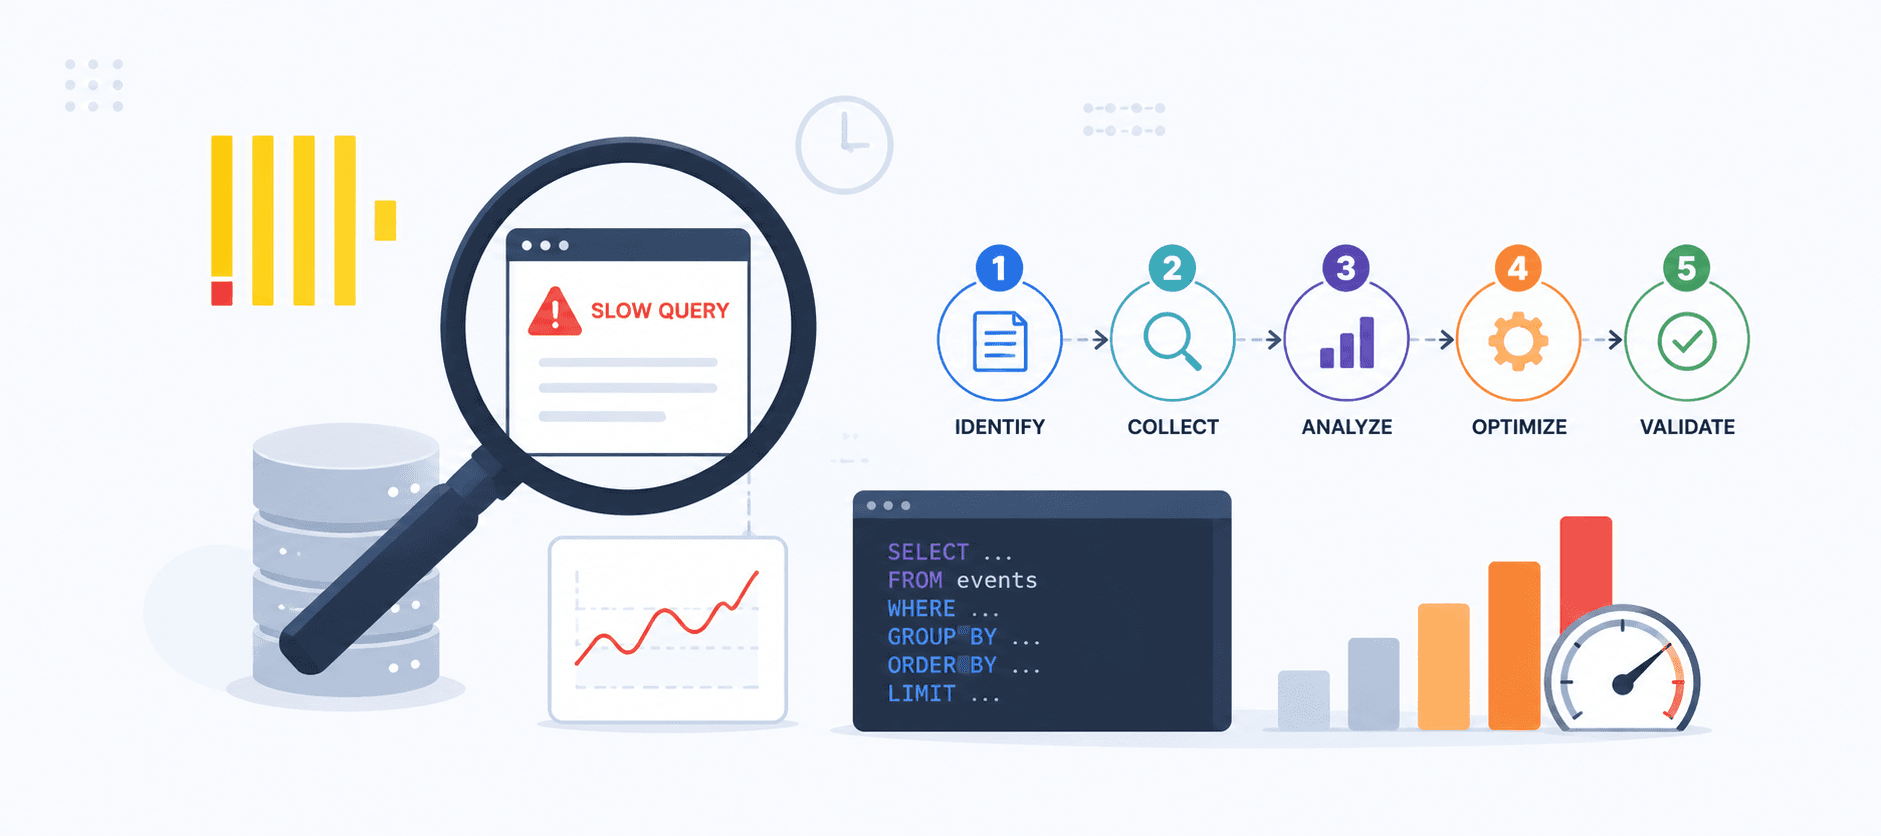
ClickHouse is blazingly fast for analytical workloads, but complex queries, large datasets, or suboptimal configurations can turn seconds into minutes. When queries start crawling, apply a systematic approach to performance optimization.
The 5-Step Slow Query Investigation Framework
Step 1: Identify the Culprit
Start with the basics — what’s actually slow? Check currently running queries.
SELECT
  query_id,
  user,
  query,
  elapsed,
  memory_usage,
  read_rows,
  read_bytes
FROM system.processes
WHERE elapsed > 10
ORDER BY elapsed DESC;- Is it a specific query or pattern?
- Are multiple queries competing for resources?
- Is it a new issue or gradual degradation?
Step 2: Analyze Query Execution
Dive into execution metrics from the query log.
SELECT
  query_id,
  query,
  elapsed,
  read_rows,
  read_bytes,
  result_rows,
  memory_usage,
  peak_memory_usage
FROM system.query_log
WHERE query_id = 'your-query-id'
ORDER BY event_time DESC;- Read Rows vs Result Rows: a high ratio suggests inefficient filtering.
- Memory Usage: spikes suggest expensive operations.
- Read Bytes: large scans point to missing data skipping or pruning.
Step 3: Examine the Execution Plan
Understand what ClickHouse is actually doing.
EXPLAIN PLAN
SELECT your_slow_query_here;
EXPLAIN ESTIMATE
SELECT your_slow_query_here;- Full table scans on large tables
- Cross joins without proper filtering
- Complex aggregations without pre-aggregation
- Missing partition pruning
Quick Wins for Immediate Relief
Emergency response: kill problematic queries and set session limits.
KILL QUERY WHERE query_id = 'problematic-query-id';SET max_memory_usage = 5000000000;
SET max_execution_time = 300;Key Takeaways
- Start with measurement to pinpoint what’s slow.
- Use plans to find the root cause.
- Optimize incrementally — one bottleneck at a time.
- Monitor continuously to prevent regressions.